
Better references.
The cheap model stayed.
We tested three vision models on meals with measured ingredient weights. The results gave us a more honest accuracy picture, but no convincing reason to switch.
Our first calorie benchmark had a weakness: we had estimated the portions in its reference photos by eye. That was useful for finding obvious mistakes. It was a poor way to decide whether a small difference between models meant better real-world accuracy.
In our Jev experiment, we said the next comparison needed better reference data. This is that follow-up. We used Nutrition5k, a public research dataset that pairs meal imagery with measured ingredient masses and nutrition calculated from USDA data.
We kept Gemini 3.1 Flash Lite as our primary model. Gemini 3.5 Flash Lite was a credible challenger at a similar speed. The more expensive Gemini 3.8 Flash did not earn its additional cost and waiting time in this test.
Keeping the model does not mean accuracy is solved. Only 48 of the current model’s 96 attempts landed within 25% of the reference calories.
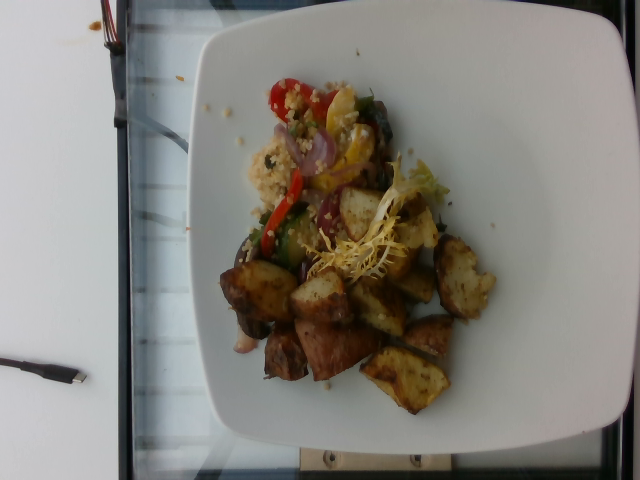

A stronger reference,
still an estimate
This plate’s source records list measured portions of roasted potatoes, quinoa and olive oil, totalling about 244 g and 345 kcal.
The weights were measured by the dataset authors. Calories were calculated from food-composition records, not measured through chemical analysis. We did not prepare or weigh these meals ourselves.
What the full pipeline produced
| Model | Valid attempts | Within 25% kcal | Median calorie error | Mean absolute calorie error | Cost per 1,000 scans |
|---|---|---|---|---|---|
| Gemini 3.1 Flash Lite Current primary | 96/96 | 48/96 | 25.1% | 103.0 kcal | $0.70 |
| Gemini 3.5 Flash Lite | 96/96 | 52/96 | 20.3% | 94.9 kcal | $0.98 |
| Gemini 3.8 Flash | 95/96 | 47/96 | 25.6% | 95.8 kcal | $4.59 |
48 source groups, two passes each. Repeats are not additional independent meals. Error metrics use valid results; success and within-25% counts include every attempt. Model cost includes vision and nutrition fallback, including unsuccessful calls, and excludes hosting and top-up fees. These are observed September 18 costs.
A promising average is not a reliable win
For each source group, we averaged its two runs and compared models on the same meal. Gemini 3.5 Flash Lite reduced mean calorie percentage error by 8.7 percentage points. But the paired 95% bootstrap interval ran from a 19.8-point improvement to a 1.0-point worsening.
That interval includes no improvement. Its carbohydrate and fat errors improved, while protein error increased. We had set the decision rule before running the test, and the candidate did not pass it.
The cost difference was small: about $0.29 per 1,000 scans. A better result would justify that increase. What we needed was stronger evidence of the benefit.
The larger model made people wait
| Model | Median | 95th percentile |
|---|---|---|
| Gemini 3.1 Flash Lite | 2.04 s | 3.36 s |
| Gemini 3.5 Flash Lite | 1.94 s | 3.30 s |
| Gemini 3.8 Flash | 4.89 s | 15.86 s |
Vision plus nutrition execution using warm, frozen USDA candidate pools. This excludes database network retrieval, phone upload, edge startup and screen rendering. It is not measured app response time.
Gemini 3.8 Flash cost about 6.6 times as much as the baseline. Its calorie improvement was also statistically uncertain, and its 95th-percentile pipeline time exceeded our predeclared 15-second target.
One of its nutrition calls returned an upstream rate-limit error inside an HTTP 200 response with no answer content. We counted the scan as a failure and did not silently retry it with another model. One event does not establish a provider-wide reliability rate.
What we held fixed
- The same photos. 48 fixed source groups, selected before model calls from Nutrition5k’s official test IDs. We conservatively grouped related ingredient-addition stages and used one RGB image per group.
- The same recognition task. Every model received identical image bytes, our production scan prompt and JSON schema. Reference weights, ingredients, calories, filenames and depth images were withheld.
- The same food matcher. All arms used matcher v4 and frozen USDA search results. Each model also handled its own nutrition fallback when no suitable database record was found.
- The same decision rule. At least five percentage points lower mean plate calorie error, a paired confidence interval below zero, no material macro regression, no additional failures, and acceptable median and tail latency.
The complete experiment made 388 billed model requests: 288 vision calls and 100 nutrition calls. Total confirmed cost was $0.602433, within the $1 experiment cap, with no unresolved charges. Saved requests, responses and candidate pools let us audit costs and recalculate totals without buying the same answers again.
What this test cannot tell us
All 48 selected groups came from one cafeteria. The specialized camera, our reference-consistency filter and possible exposure to public training data limit how far the results generalize. USDA-derived reference values may also favour agreement with the same database.
We preserved ingredient references and predicted foods, but did not independently label every correspondence between them. That means this run cannot cleanly split the error into wrong food identity, wrong portions and wrong nutrition records. Database coverage alone is not an accuracy score.
The earlier nine-photo scores and this benchmark use different images and different reference methods. A larger error here does not show that the product became worse. It shows why the reference matters.
October 7 update: fixing the food matcher
Auditing the saved food records exposed mistakes in the code around the model: steamed cauliflower could match fried cauliflower, a roasted chicken drumstick could match chicken skin alone, and berries could match a snack bar. Matcher v5 now rejects these incompatible choices while preserving explicitly requested preparations. It also handles accented preparation names such as sautéed.
We replayed the saved responses and frozen USDA candidates without buying any model answers again. For Gemini 3.1 Flash Lite, 89 of 96 meals could be fully reconstructed. On those same 89 meals, mean absolute calorie error changed from 103.2 to 90.7 kcal. This is a post-hoc diagnostic on a selected subset, not independently measured improvement. Seven meals need new nutrition estimates that the historical calls never produced, so their corrected totals remain unknown. We did not count them as zero or silently remove food items.
The replay retains every original model failure. Qwen and MiMo produced unusable results on 7 of 8 and 19 of 37 attempted scans respectively in our October screening configuration. Their incomplete runs do not support an accuracy ranking or a deployment recommendation. A precise answer is useful only when the service reliably returns it.
The incumbent model stays Gemini 3.1 Flash Lite. In this development set, two of its 96 scans newly require the nutrition fallback call; one stops requiring it. That is 34 scans needing fallback instead of 33. Reusing old answers does not measure the new production latency or failure rate.
Better references need an image audit too
We found additional public weighed-food sources. DFood-TJ provides 3,280 phone photos with food weights and table-derived nutrition under CC0. We imported 64 development references and reserved 128 confirmation references, separating participants across the two sets and excluding duplicate image files. FlavoriaFoodWeight1700, under CC BY 4.0, adds lunch-line imagery and component weights, but its CSV files do not supply calorie references.
Follow-up, October 7: we masked readable scale and weight cues, excluded unsafe overlaps and near-duplicate photos, and retained 61 development and 118 confirmation photos. Both models used the same prepared inputs and production analysis code. Read the completed DFood model comparison and confirmation check for the separate results and their limitations.
The next study
The production primary stays Gemini 3.1 Flash Lite. Our DFood study tested Mistral Large 4.0, corrected additional food identities and evaluated the retained model on a frozen confirmation split. It is a separate dataset and experiment; its results should not be merged with the historical Nutrition5k table above.
For someone logging a meal, the practical advice stays the same: review the identified foods and portions, and correct missing ingredients. A plausible calorie total is still an estimate.
Sources, complete results and research disclosure
This is KcalSnap’s own development comparison, not an independent product evaluation. No private user photos were used. AI tools assisted the analysis and writing; KcalSnap is responsible for the interpretation and production decision.
Dataset: Nutrition5k, Thames et al., CVPR 2021, paper, CC BY 4.0. Download the aggregate results as JSON or full method and findings, including protein, carbohydrate, fat and mass errors.
Model IDs: google/gemini-3.1-flash-lite, google/gemini-3.5-flash-lite, google/gemini-3.8-flash. Experiment completed September 18, 2026. Published October 6, 2026.
Earlier: Can you trust an AI’s calorie count? · Why we didn’t ship Jev